Method validation is paramount to the success of any analytical laboratory—regardless of industry—whether the lab is a third-party testing lab or an in-house lab in an extraction facility. The latter type of laboratory is an important aspect of novel product design and formulation. It’s more powerful to know, for example, whether a hemp extract is above or below the 0.3% cut off for delta-9 tetrahydrocannabinol (THC) prior to shipping it anywhere, or whether intended label claims actually are met by your batch product. In-house testing can save time, money, and an extraction product, which is why you’re reading this blog for Extraction Magazine, for a change, instead of Terpenes and Testing.
It’s important for any lab to exhaustively test their techniques in order to ensure that data released to clients—and ultimately the general public—is defendable and trustworthy. Some agencies, like ASTM International, the American Herbal Products Association, and AOAC International, offer guidance to analytical labs measuring cannabis and its myriad of products. Thankfully, to quicken the pace of forging the path to standardized methods, tried and proven, other research groups at universities or within companies are also designing methods for quantifying cannabis constituents. One such method was recently published in the Journal of Chromatography B. [1]
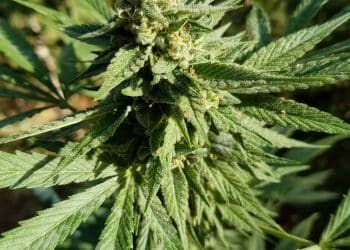
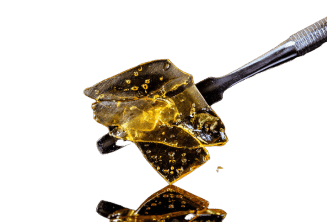
The authors evaluated cannabis flowers and extracts produced using supercritical fluid extraction. In addition, the proposed methodology adhered to International Council for Harmonisation of Technical Requirements for Pharmaceuticals for Human Use and U.S. Food and Drug Administration method validation regulations under Good Manufacturing Practice. [1] This is a key facet of the experimentation since, to date, validated methods have been designed on cannabis flower [2] but not extracted products. The data generated by this method was compared to recommendations from the Centre for Drug Evaluation and Research Validation of Chromatographic Methods as a part of the United States Pharmacopeia. [1]
A main limitation of the method was that only cannabinoids were quantified, including: tetrahydrocannabinolic acid (THCA), tetrahydrocannabinol (THC), cannabidiolic acid (CBDA), cannabidiol (CBD), cannabinol (CBN), and cannabichromene (CBC). No characterization of the terpene profile was endeavored, nor other minor cannabinoids of interest like cannabigerol (CBG) or tetrahydrocannabivarin (THCV). [1] Nonetheless, the study is a welcome addition into the cannabis literature fold, especially since many states in the US unfortunately don’t require terpenes or minor cannabinoids to be listed on product labels.
The authors used ultra-high-performance liquid chromatography (UHPLC or UPLC). [1] UPLC differs from HPLC in that faster run times are possible and the systems are capable of being operated at much higher pressures, which provides enhanced chromatographic resolution.
The method was validated for the customary metrics, including accuracy, precision, linearity, specificity, robustness, limit of detection, limit of quantification (LOQ), and stability at the detection wavelength used (280 nm). The latter was assessed by exposing the samples to ultraviolet light, and in a separate experiment by using an elevated temperature, for 1 hour. The samples were also quantified on a weekly basis across four weeks to evaluate sample stability. [1]
The extraction percent recovery of spiked cannabinoids into cannabis flower and oil samples enabled the assessment of the method’s accuracy. This is typically done by first measuring the background matrix to determine if the analytes of interest (in this case, cannabinoids) are detected therein. Then, the analyst adds known amounts of the analyte into the matrix and quantifies that amount. The ratio of the amount detected over the amount added is subsequently multiplied by 100 to provide the amount of analyte recovered as a percentage. The researchers achieved percent recoveries ranging from 98.71% to 100.10%, illustrating the accuracy of method. [1]
Linearity was determined through the measurement of a calibration curve, where 8 to 9 different concentrations, depending on the cannabinoid, were quantified and plotted against the measured signal. The signal was detected using a 280 nm wavelength, which demonstrated a better linear range and also decreased signal contributions stemming from impurities. [1] These data points were fit using a linear trendline, and the coefficient of determination (R2) provided the goodness of fit between the individual points and the line, which can be described algebraically using the y=mx+b formula, where y is the signal, m is the slope of the line, x is the analyte concentration, and b is the y-intercept (or where the trendline would cross the y-axis).
The equations provided in this method, however, did not include the b value, which indicates that the authors forced their trendline through the 0,0 point on their calibration curves, a practice that is not really recommended since (a) a blank is commonly measured, which provides real data for that 0,0 point, and (b) it causes the analyst to make an assumption regarding the slope of the trendline. Assumptions shouldn’t have a place in the lab, where numbers can be used instead. There is abundant literature regarding forcing through zero and when it should or shouldn’t be employed. Most often, experts conform to the latter. I’ve seen cases in labs where switching from improperly forcing through zero to not doing so increased the lab’s LOQ by at least one order of magnitude.
The authors indicate the measurement of robustness, which is defined by making small, deliberate changes in one’s method. This study, however, switched up the analyst and made comparisons between the two, which is not actually a test of robustness but rather of the method’s ruggedness. [1]
References
[1] Elkins, Aaron et al. “Development of a Validated Method for the Qualitative and Quantitative Analysis of Cannabinoids in Plant Biomass and Medicinal Cannabis Resin Extracts Obtained by Super-Critical Fluid Extraction.” Journal of Chromatography B, vol. 1109, 2019, pp. 76–83. [journal impact factor = 2.813; cited by 1 (ResearchGate)]
[2] Giese, Matthew et al. “Method for the Analysis of Cannabinoids and Terpenes in Cannabis.” Journal of AOAC International, vol. 98, no. 6, 2015, pp. 1503-1522. [journal impact factor = 1.12; cited by 29 (ResearchGate)]
