The method was introduced at the beginning of the 1950s. GC is designed for the separation of volatile components such as terpenes. Very complex mixtures can be solved through the identification of the peaks resulting from the Gas Chromatograph allowing the recognition and quantification of all the substances in the mixture. It is the preferred choice both for aromatic gaseous mixtures such as essential oils, but also for identifying organic contaminants, solvent residues and verifying safety and quality standards in food samples. [1]
The sample is initially vaporized, upstream of the injector, injected into the column and run through it. Different compounds in the sample interact differently with the stationary phase, leading to their separation as they travel at varying speeds through the column. [1]
Components and Process of Gas Chromatography
When pumped into the injector port the sample is vaporized immediately. The carrier gas, the mobile phase, transports the vaporized mixture into the column. The sample travels through the column and its components interact with the stationary phase, in this way an affinity or, better said, retention gradient is created which will determine different elution times and therefore detection of the output signal. This is important information for the characterization of substances.
The Injector
The injector is where the sample is introduced into the GC system. A consistent infusion into the column ensures an accurate separation and analysis.
The Column
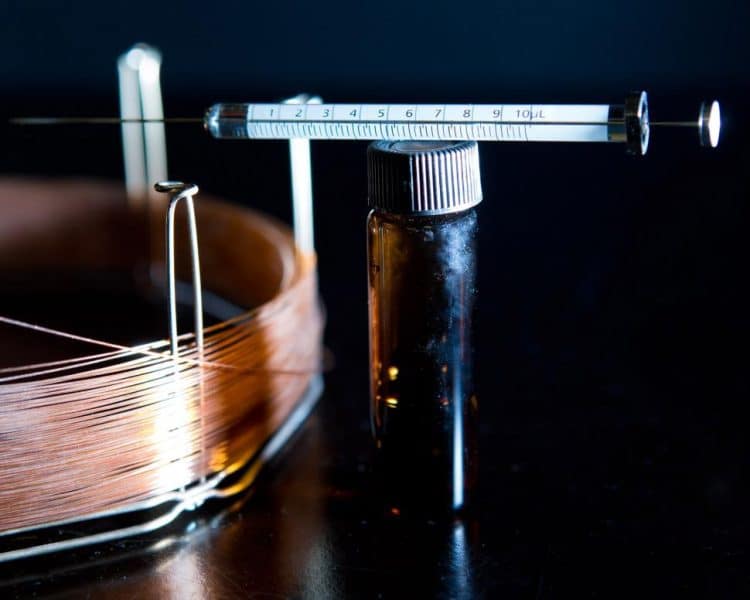
The column is chosen based on the needs of the analysis in progress, it is the most important part of the Gas Chromatograph and is often composed of fused silica, a “glass” which is internally coated with the stationary phase.
Here some examples:
- Capillary columns: are more commonly used due to their high resolution.
- Packed columns: use solid stationary phase for compound separation.
- Planar columns use microfabricated channels on silicon wafers for fast, efficient separation in gas chromatography, enhancing speed and resolution.
- Narrow bore columns: with small internal diameters, provide high resolution and efficiency in gas chromatography, ideal for complex mixture analysis.
- Water-compatible ionic liquid-coated columns: offer enhanced selectivity and stability for chromatographic separations, particularly in aqueous environments, improving analytical performance. [2]
The Mobile Phase
The mobile phase, or eluent, is therefore an inert gas, commonly helium, hydrogen or nitrogen. The choice of eluent gas affects the separation. The affinity for the stationary phase and for the mobile phase (which is continuously refluxed) creates sections of concentration gradient of eluent and solutes in it. These gradient segments are defined as theoretical plates, and the more efficient the choice of the stationary and mobile phases is, the smaller and more numerous these plates will be, furthermore the entire separation will gain in resolution.
The peaks will be very distinct and the identification precise.
How to choose the mobile phase with respect to the characteristics of the gas type
- Helium: is widely used due to its inertness and optimal flow characteristics.
- Hydrogen: offers faster analyses and higher efficiency but requires safety precautions.
- Nitrogen: offers slower analyses but excellent resolution and inertness. [2]
The Stationary Phase
As mentioned above, the stationary phase is a coating inside the column, it can be solid or liquid. Parameters such as affinity and temperature ramp programming determine the detection characteristics of the analytes at the column outlet, such as retention time, but also influence the quality of the separation itself.
For the separation, the affinity for the stationary phase is therefore exploited, in fact for non-polar compounds stationary phases are made of dimethylpolysiloxane, a non-polar coating, while for polar compounds the columns are chosen with polar stationary phases such as polyethylene glycol. [2]
At this point we must highlight the rule according to which compounds with greater affinity for the stationary phase move more slowly and are eluted last, while those with lower affinity travel faster and elute first, with consequent separation.
The Detector
Let’s go back to describing the detector, that is, that part of the equipment responsible for quantifying and identifying the components as they are eluted from the column. As the separated compound exits the column, passing through the detector, it generates a signal proportional to the amount of each constituent.
We can mention some detectors: Flame Ionization (FID) highly performing in the detection of hydrocarbons; Mass Spectrometers (MS) that provide detailed molecular information on compounds of interest; Electron Capture Detectors (ECDs) which quantify the compounds that absorb electrons by measuring the decrease of these in the supplied current, due to capture by the target chemical species. [1]
The Data System
The data system records the signals from the detector and converts them into a chromatogram: a graphical representation of the composition of the sample.
The Chromatogram
How is it possible to understand the meaning of the chromatogram? It is a rather complex process for unknown compounds, but for known compounds it is possible to compare the retention times found in the scientific literature.
Obviously, laboratory methods must be the same for two studies to be compared, and analyses are often carried out following known methods. Furthermore, an essential step is the preparation of the calibration line. This line is created by providing the detector, with increasingly larger quantities in terms of concentration, of the same standard molecule which will then correspond to specific detector responses. It is also possible to compare the concentrations of unknown samples, detected in the chromatogram, thanks to the comparison with those of known molecules.
The area under the curve of these peaks must be compared to that of the calibration line in order to obtain an accurate quantification of the analyte concentration.
Fundamental Parameter: Temperature
The temperatures of both the injector and the column are fundamental parameters that significantly impact the separation and analysis of compounds.
Injector Temperature
Vaporization of the sample at the injector level can occur at a minimum of 200°C to a maximum of 300°C. The inlet temperature is set above the boiling point of the analytes to prevent any condensation which could lead to poor reproducibility and peak broadening. At the same time, care must be taken not to set a temperature that causes the decomposition of thermally labile chemical species. [2]
Column Temperature
The column temperature, controlled by the oven, determines the separation efficiency and resolution of the analytes. It can be isothermal, that is constant temperature, or programmed temperature ramp. Isothermal conditions are suitable for simple mixtures, where all components have similar boiling points.
For more complex mixtures with a wide range of boiling points, temperature programming is used, starting at a lower temperature to separate volatile components and gradually increasing to elute higher-boiling compounds. Typical column temperatures range from 40°C to 350°C. The choice of temperature program depends on the volatility and thermal stability of the analytes and the desired resolution. [2]
Optimizing both injector and column temperatures is essential for achieving high-quality chromatographic separations, minimizing analysis time, and ensuring reproducibility.
Practical Examples of GC in Botanical Extracts Analysis
The following examples demonstrate the versatility and effectiveness of gas chromatography in various applications related to botanical extracts, contaminants detection, and food safety compliance.
Scientists in 2012 examined the volatile profile of lavender essential oil (Lavandula angustifolia L.) using gas chromatography-mass spectrometry (GC-MS). Compound separation performed by GC, followed by MS, allows the molecular components to be accurately identified and quantified. The researchers analyzed key volatile compounds such as linalool, linalyl acetate and camphor, which are evaluative for the quality and therapeutic properties of lavender oil. This study demonstrated the effectiveness of GC-MS in profiling complex botanical extracts. [3]
In 2014, authors evaluated planar columns for analyzing chamomile (Matricaria chamomilla L.) essential oils. The planar columns provided separation efficiency comparable to conventional narrow bore columns. This study highlighted the effectiveness of planar columns in analyzing complex botanical extracts, demonstrating their application in profiling chamomile volatiles such as bisabolol oxides and chamazulene. [4]
In 2019, it has been demonstrated that the use of direct injection GC-FID is profitable to analyze peppermint (Mentha piperita L.) herbal teas. By using water-compatible ionic liquid-coated columns, it was possible to accurately quantify volatile compounds such as menthol and menthone. This method significantly reduced analysis time and improved reliability by eliminating intermediate sample preparation steps. [5]
The analysis of sage (Salvia officinalis L.) essential oil using Linear Retention Indices (ITS) on planar columns showed reliable identification of terpenoids like α-pinene and β-pinene. This approach is particularly useful for in-field analysis where micro-GC with mass spectrometry is still developing. ITS are a method used in GC to standardize the retention times of compounds for better comparison and reproducibility.
Developed by van Den Dool and Kratz in 1963, ITS are calculated using a reference series of n-alkanes (hydrocarbons) under identical chromatographic conditions. The index assigns a numerical value to each compound based on its retention time relative to the n-alkanes. The use of ITS provides confident identification of analytes, essential for quality control and regulatory compliance. [6]
Cereal samples were analyzed to verify the presence of mycotoxins: Aflatoxins, Ochratoxin A and Trichothecenes. The main contaminants of foodstuffs stored at too high temperatures and in lack of oxygen are in fact a tool for molds to survive an unfavorable environment. Unfortunately for consumers, these are secondary metabolites produced by molds of the Aspergillus, Penicillium and Fusarium genera.
Harmful to human health, they have concentration limits regulated by law. The method used by the researchers is GC-ECD, which allowed the accurate determination of mycotoxin concentrations, ensuring compliance with safety standards. [7]
Research conducted in 2005 aimed to develop a method for detecting pesticide residues in fruits and vegetables using GC-MS/MS. The method performs separation of compounds via GC, followed by two MS for detailed molecular analysis, improving sensitivity and specificity. It enabled the identification and quantification of multiple pesticide residues in a single analysis, providing a reliable approach to monitoring food safety and compliance. [8]
Troubleshooting Common Issues in GC
GC can present several problems that affect the precision and trustworthiness of the analysis.
Baseline noise in the GC can result from contaminated carrier gases, dirty injector ports, or degraded columns. To resolve this issue, be sure to use high purity carrier gas, clean and maintain inlet ports regularly, and replace the column when necessary. In a study conducted in 2018, researchers took on the challenge of separating volatile organic compounds (VOCs) from roasted coffee using ionic liquid columns. Low bleed (the natural degradation process of stationary phase) and high thermal stability of the ionic liquid columns were observed, which helped reduce baseline noise. They emphasized the importance of using proper temperature settings for the column and injector to further minimize baseline noise. [9]
Peak tailing often occurs due to active sites in the column or improper column conditioning. To resolve peak tailing, condition the column according to the manufacturer’s instructions before use, and ensure the column is properly deactivated. Using guard columns or inline filters can also help protect the analytical column from contamination and reduce peak tailing. For example, in the analysis of sage essential oil reported above, the authors used planar columns with optimized stationary phases to minimize peak tailing and achieved reliable separation of terpenoids. [6]
Poor resolution between peaks can result from incorrect column choice, improper temperature programming, or inadequate column length. To improve resolution, select a column with the appropriate stationary phase and dimensions for the specific analysis. Optimize the temperature program to allow sufficient separation time for closely eluting compounds. In the study on peppermint herbal teas already mentioned, the researchers used water-compatible ionic liquid-coated columns and optimized temperature settings to achieve clear separation and accurate quantification of key volatile compounds. [4]
A drifting baseline can be caused by fluctuations in carrier gas flow, temperature inconsistencies, or leaks in the GC system. To address this issue, ensure stable carrier gas flow by regularly checking and maintaining gas lines and pressure regulators. Verify that the oven and injector temperatures are stable and accurately controlled. Additionally, inspect the system for any potential leaks and repair them promptly. The study on chamomile VOCs highlighted the importance of stable carrier gas flow and precise temperature control in maintaining a stable baseline and achieving consistent results. [5]
References:
- Chiara Cordero, Cecilia Cagliero, Erica Liberto, Barbara Sgorbini, Patrizia Rubiolo, Carlo Bicchi, 9 – Gas chromatography. Editor(s): Yolanda Pico, Chemical Analysis of Food (Second Edition), Academic Press (2020).
- Skoog, D.A., Holler, F.J., & Crouch, S.R. “Principles of Instrumental Analysis (7th ed.)”. Cengage Learning (2018).
- Stanley Deans, Louise McGarvey, John Caldwell, “Analysis of volatile components in lavender essential oils by gas chromatography-mass spectrometry.” Phytochemistry (2012).
- Cagliero, C., Sgorbini, B., Cordero, C., Liberto, E., Bicchi, C., & Rubiolo, P. “Analytical strategies for multipurpose studies of a plant volatile fraction.” Handbook of Chemical and Biological Plant Analytical Methods (2014).
- Barbara Sgorbini, Chiara Cordero, Cecilia Cagliero, Erica Liberto, Patrizia Rubiolo, Carlo Bicchi, “Quantitative analysis of volatile compounds in peppermint herbal teas using water-compatible ionic liquid coated columns.” Journal of Chromatography A (2019)
- Cecilia Cagliero, Barbara Sgorbini, Erica Liberto, Chiara Cordero, Patrizia Rubiolo, Carlo Bicchi, “Evaluation of planar columns for the analysis of sage essential oils.” Journal of Chromatography A (2016).
- Rudolf Krska, Reingard Schuhmacher, Hans L. Müller, “Gas chromatographic analysis of mycotoxins in cereals.” Food Control (2001).
- Imma Ferrer, Michael Thurman, E. Michael Zweigenbaum, “Determination of pesticide residues in fruits and vegetables by gas chromatography tandem mass spectrometry.”, Analytical Chemistry (2005).
- João Amaral, Philip Marriott, Eduardo Bizzo, Marcelo Rezende, “Challenging separation of roasted coffee volatiles using ionic liquid columns.” Journal of Chromatography A (2018).
