Like the instrumental evolution of classic column liquid chromatography, the HPLC takes advantage of the difference of affinity and interactions of each mixture component for the stationary and mobile phase leading to different retention times. This method found applications in various fields such as pharmaceutical, environmental sciences, and food science. [1]
High Performance Liquid Chromatography was developed in 1967 at Yale University, it is also known as high-pressure liquid chromatography because is characterized by using columns packed with very small particles, the stationary phase, and an eluting liquid phase, the mobile phase, pumped at high pressure through the column. [2]
The ability of the packed material to retain and separate compounds from a complex mixture is determined by functional groups chemically bonded to the surface of a support. The solute interacts with the functional groups via hydrogen bonds, dipole-dipole or electrostatic interactions. It has represented a significant advance in analytical science by revolutionizing the separation of complex extract mixtures. [2]
Importance of HPLC in Botanical Extraction
This technique offers high precision and accuracy that are essential for identifying and quantifying molecules. Because of its versatility, it can be used for the isolation of a wide range of botanical compounds including alkaloids, flavonoids, phenolics, and terpenes. Thanks to the possibility of standardizing operations, reproducibility is ensured, which is useful for quality control and suitable for rapid analysis (carried out in 30 minutes or less), in both research and industrial settings. [3]
Equipment
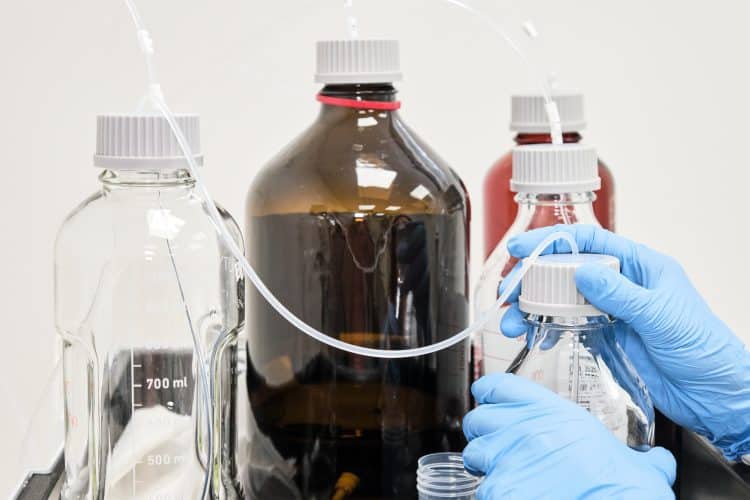
An HPLC consists of several assembled components. Generally, includes a sample filtration and eluent degassing system, containers for the eluent and for its discharge, an injection valve and possibly a sampler automatic, one or more pumps with their own controller, precolumn and column, one or more series detectors, and a data collection system. [2]
Materials
Samples and their preparation are primary for accurate analysis to identify and quantify the chemical constituents of leaves, stems, roots, seeds and flower extracts. The first step in specimen processing is extraction. The most commonly performed are solvent extraction, supercritical fluid extraction and solid phase extraction. [4]
Once extracted, samples may need purification to remove interfering substances. This can be achieved by liquid-liquid extraction, filtration or centrifugation. The purified extracts are typically concentrated to improve detection sensitivity. High purity solvents and reagents are essential to minimize contamination and ensure reproducibility. [4]
To directly perform HPLC, the purified extract might have to be filtered and diluted with the mobile phase or an appropriate solvent. Filtration is carried out using special porous membranes, with holes that can reach 0.20 μm. Instead, if the sample is to be preserved will be stored in appropriate conditions, basically refrigerated and in the dark, to prevent degradation.
Eluent degassing is achieved by pumping the liquid under vacuum through membranes or allowing an inert gas such as helium to flow into the liquid, to remove dissolved air, which may collect in bubbles along the chromatograph circuit. [5]
The sample is introduced into the circuit using a syringe connected to a valve of injection. The purpose of this system is to allow the sample to enter the circuit while maintaining the latter, which is almost always under pressure, isolated from the outside.
Often the injection valve is part of an automatic sampler, which injects from time to time from the vials in which it is contained. Preparative HPLC pumps are often peristaltic, while most of the analytical HPLC pumps on the market are made up of a piston moved by a motor, and the flow direction is ensured by two check valves. The pump is equipped with a pressure gauge in the circuit. [5]
Selection of Columns and Solvents
The choice of columns is decisive and depends on the chemical nature of analytes. The columns can be housed in special compartments created in the pump container, and these are often thermostated to optimize the stationary phase performance.
The chromatographic circuit consists of small steel or PEEK (polyetheretherketone) tubes with an internal diameter of up to 0.25 mm. The precolumn is packed with the same stationary phase as the column, but has a lower length, and therefore cost. It serves to protect the column from possible damaging pollutants contained in the samples, which can bind to the stationary phase, decreasing its performance.
Normal-phase columns are suitable for polar compounds because the stationary phase, usually Silica gel, is more polar than the eluent used.
Reverse-phase columns are ideal for non-polar and moderately polar compounds because the stationary phase is apolar with respect to the eluent used. The most used are C18 columns, so called because the particles packed, made of silica gel or polystyrene-divinylbenzene, have hydrocarbon groups with 18 carbon atoms bound to the surface. The RP columns offer high resolution for a wide range of botanical compounds.
Ion exchange columns are used to separate ionic substances. The stationary phase is prepared by binding ionic functional groups to silica gel or to a porous support polymer (i.e. polystyrene); when the groups have a negative charge, the columns are called cation exchange, if they have a positive charge, they are called anion exchange. Aqueous buffers are used as eluent, possibly mixed with organic substances.
The strength of the eluent increases with the increase in the ionic strength of the buffer, species with a light charge will be eluted at lower concentrations, and those with a greater charge will be eluted as the concentration increases; furthermore, retention is influenced by the pH of the mobile phase and the content of organic solvent present.
Size exclusion columns are used to separate compounds based on sites of different sizes useful for larger biomolecules (proteins, DNA, etc).
The mobile phase should be chosen complementary to the column to increase the separation. It often consists of a mixture of water and an organic solvent such as acetonitrile or methanol supplemented with acids or buffers to improve peak shape and resolution. Gradient elution, in which the composition of the mobile phase changes over time, is efficient in complex mixtures. [5]
Optimization of Operational Parameters
Flow rate is one of the key parameters that affect the time that analytes spend in the column and their separation. A lower flow rate generally increases separation efficiency but extends time, while a higher flow rate reduces analysis time but may compromise resolution. The best parameter balance typically ranges from 0.5 to 1.5 mL/min. Adjustments are based on the specifications of columns provided by the manufacturer, and are related to the desired resolution. [6]
Another important parameter is the column temperature that has an influence in the interaction between the analytes and the stationary phase. Higher temperatures increase the speed but can lead to peak broadening.
Conversely, lower temperatures improve resolution but prolong analysis time. It is important to figure out the optimum, usually between 25 and 40°C, that provides the best compromise between the speed and resolution, keeping it constant to improve reproducibility. [6]
The injection volume must always be controlled to avoid overfilling the column, which can lead to peak distortion and loss of resolution. Typically, from 10 to 20 microliters, the volume depends on the column capacity and sample concentration. [6]
The detection wavelength is selected based on the absorption characteristics of the analytes.
- UV-Vis detectors are the most commonly used, and the wavelength is selected to maximize the response of the target compounds. This method is suitable for compounds with chromophores.
- Diode array detectors (DAD) permit to monitor multiple wavelengths simultaneously, providing more comprehensive information about the sample composition. DAD provides spectral information from which databases are created that allow the identification of unknown compounds while avoiding dereplication phenomena.
- HPLC can be performed in association with mass spectrometry (MS) that offers high sensitivity and specificity, allowing for the identification and quantification of trace compounds.
Data Collection and Analysis
First, the researcher should ensure that the HPLC system is configured correctly.
Start by degassing the mobile phase, then equilibrate the column by flowing the mobile phase through the column until a stable baseline is reached. By checking system parameters, verify flow, pressure and temperature settings according to the method protocol.
The run time must be set appropriately to guarantee that all compounds of interest elute from the column.
Data integration is performed using chromatographic software to integrate peaks and quantify compounds based on calibration curves. Peak identification is achieved by comparing retention times and spectral data with reference standards or literature values. [6]
After each analysis, don’t forget to clean the columns by washing with an appropriate solvent to remove residual compounds. Worn parts such as pump seals, injector seals and filters must be checked and replaced regularly. Periodic calibration with known standards and regular maintenance of the HPLC system helps preserve accuracy. [5]
Interpretation and Validation of Results
The interpretation of HPLC results involves analyzing chromatograms to identify and quantify the components of the sample. A chromatogram displays the detector response as a curve function of time, with each peak representing a different compound.
In fact, the retention time is a characteristic parameter that allows the compound that produced it to be unequivocally identified by comparing it with those of known standards. However, retention time alone may not be sufficient which is why it is combined with spectrometric analysis results for positive identification.
- Quantification is generally performed by measuring the area under the peak curve.
- Calibration lines, constructed using known concentrations of standards, are essential to balance the linear response of the detector over the range of concentrations encountered. [6]
Assessment of Parameters
Accuracy and precision are vital for reliable quantification. The former refers to how similar the measured values are compared to the actual value of the quantity of analytes in the sample. The second describes the regularity of responses when measurements are repeated under the same conditions. High precision means that repeated measurements produce similar results. [6]
HPLC method validation includes testing for linearity, which means that results (such as peak area or peak height) increase in direct proportion to the analyte concentration. This assures that as it takes more of a substance, the measurement reflects that increase. [6]
The smallest amount of an analyte that can be detected but not necessarily quantified is the limit of detection (LOD), it indicates the lowest concentration at which the analyte can be distinguished from the noise. Instead, the limit of quantification (LOQ) is the smallest amount of an analyte that can be quantitatively measured with acceptable precision and accuracy. It is higher than the LOD and ensures safe quantification. [6]
Robustness is the ability of the HPLC method to provide the same performance even with small variations in parameters like slight changes in temperature or flow rate and still produce great results. [6]
System Suitability Tests
These tests are conducted regularly to ensure the HPLC system is working correctly, and they include measurements of: peak symmetry which indicates good separation and proper functioning of the system; retention time repeatability by checking that the time it takes for an analyte to travel through the column remains consistent; theoretical plate count that is a measure of column efficiency, indicating how well the column separates. [6]
Troubleshooting
Now that it’s clear how complex this system is, let’s look at some troubleshooting.
Abnormal pressure in HPLC system can be an indicator of various problems:
- No pressure reading and no flow can be caused by air trapped in the pump or simply by the failure or shutdown of the instrument; obvious solutions are to degas the eluent and turn the instrument back on.
- Constant high pressure can result from excessive flow or blockage; solutions are to reduce the flow and possibly replace the porous septa.
- Constant low pressure is due to potential system leaks. [7]
System Leaks can be resolved with simple interventions: tighten or replace the fittings and replace the gaskets.
Problems with the chromatogram can significantly affect HPLC performance:
- Tailed peaks may indicate an exhausted column or clogged septa, in these cases it is possible to try turning and flushing the column or, at worst, replacing it.
- Split peaks are often caused by contamination of the pre-column or column inlet, here the only thing to do is replace the pre-column or column.
- Large, deformed peaks may be due to excess samples which can be eliminated by reducing the volume or concentration. [7]
Difficulties in inserting the injector may be due to the seals that need to be changed; if the sampler does not inject correctly there could be a lack of compressed air or electricity. [7]
Problems detectable with the senses (smell, sight and hearing) are indicative of mechanical wear: the smell is a symptom of leaks, high-pitched or grinding noises suggest poor lubrication or the need for replacement and maintenance. These interventions can extend the life of the system and minimize downtime. [7]
References:
- Foley, Joe P. “Liquid Chromatography: Theory and Methodology.” Analytical Chemistry (1996).
- Golay, M.J.E., & Kirkland, J.J. “Theory of chromatography and its application to high-performance liquid chromatography.” Journal of Chromatography (1965).
- B. Ramesh Kumar, “Application of HPLC and ESI-MS techniques in the analysis of phenolic acids and flavonoids from green leafy vegetables (GLVs)”, Journal of Pharmaceutical Analysis (2017).
- Mitra, Somenath, “Sample preparation techniques in analytical chemistry”. John Wiley & Sons (2004).
- [5] Reuhs, Bradley L. “High Performance Liquid Chromatography.” Food Analysis (2017).
- Indrayanto, Gunawan. “The importance of method validation in herbal drug research.” Journal of Pharmaceutical and Biomedical Analysis (2022).
- Dantu, Krishna & Sowmya, & Bhargavi, Sakala & Gopisetty, Surya & Sagar, Buthapalli & RAO, CH & Nama. Dr, Sreekanth. A REVIEW ON HPLC TROUBLESHOOTING. (2013)
