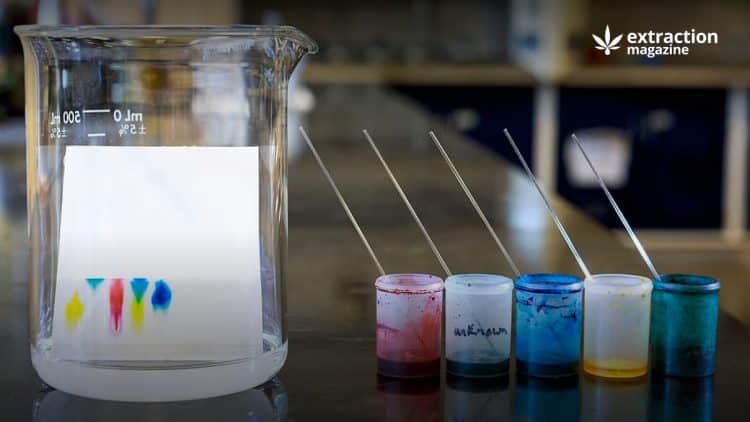
When they say chromatography, we mean the various techniques that have the aim to determine or separate single compounds from a mixture, to permit qualitative identification and quantitative analysis.
The separation is due to the differentialdistribution of the varied components between two phases: stationary phase and mobile phase, or eluent, that flows continuously through the stationary phase.[1]
From one spot of a mixture, at the end of the chromatographic process, we will obtain many spots, and each one of them is a single compound. In some cases, the stains of the single compounds are visible with normal light, other times it will be possible to use a UV-lamp to see them, or other times the spots have to be sprayed with a reactive complex to make them visible.
Thin-Layer Chromatography
TLC is a qualitative and semi-quantitative method of analysis of the variety of non-volatile components of mixtures.TLC is a planar chromatography. Plates can be made of silica gel, with a small amount of inert binder and water; this mixture is spread as a stick slurry on an unreactive carrier sheet, mostly glass, thick aluminium foil, or plastic.
Differences in the thickness of the adsorbent layer mark if the TLC is intended for analytical or preparative purposes. Other adsorbent coatings include aluminium oxide (alumina), or cellulose. [2]
In normal-phase TLC the stationary phase is polar (i.e., silica gel, alumina). With a polar stationary phase, polar compounds in a sample mixture will interact strongly. If the stationary phase is non-polar (i.e., C18-functionalized silica plates) it is called reverse-phase TLC, and in this case the non-polar compounds will be adsorbed strongly than more polar ones.
The separation of compounds depends on the difference in their affinity to the stationary phase and the relative solubility in the solvent, or mobile phase. The result is that the mobile phase competes for binding sites on the stationary phase. [3]
The different compounds in the sample mixture are eluted at different rate, due to their partition coefficients: different solvents, or mixtures of different solvents, gives different separations. [4]
In choosing the solvent, an eluotropic series can be useful: this list sorts the eluents according to how much they move certain compounds and are used to explain the power of a solvent. [4]
The retention factor (Rf) quantifies the results, and it is the ratio between the distance traveled by a substance and the one traveled by the solvent. The compounds identification is based on Rf values compared to authentic standard compounds that are run in the chromatographic process together with the sample. [5]
Single ascending development is predominantly reported for TLC analysis, but double (2D) or triple (3D) mobile phase development has been used in cases that needed to improve sample resolution, rotating of 180° and again of 90° the plate.[6]
TLC in Cannabis Analysis
TLC is often used for cannabis analysis, and it is usually performed in order to choose the best solvents for a more accurate chromatographic process such as high performance liquid chromatography (HPLC) among others.
This type complements the more expensive and difficult to perform methods such as HPLC, HPLC/mass spectrometry (HPLC/MS) among others. Thin-layer chromatography is especially valuable and often sufficient for use in resource-limited countries. [7]
A case study of qualitative and quantitative analysis of cannabis varieties showed that male and females contained similar ratios of Δ9-tetrahydrocannabinol (Δ9-THC) and cannabidiol (CBD).
The analysis was performed by TLC, GC, and MS.
Four parts of each sex were compared:
- Flowering tops;
- Small upper leaves surrounding the flowers;
- Large leaves from the lower parts of the stem;
- Lower parts of the stem.
The cannabinoids were extracted with light petroleum by grinding with a pestle in a mortar. Extracts were separated on silica gel plates with the correct organic solvent and the spots detected with an alkaline solution of color reactive. [8]
The analytical monograph Cannabis flowers included a TLC identification method. Flowers were ground and extracted. Silica gel plates were developed in a saturated chamber and sprayed with a reactive coloured solution.
Bedrocan, Bedrobinol, Bedica, and Bedropuur varieties gave a red tetrahydrocannabinolic acid (THCA) spot, and Bedolite and Bediol gave an orangespot of cannabidiolic acid (CBDA); the Rf values of all these characteristic spots in sample solutions matched the Rf values of reference extracts run on the same chromatographic plate. [9]
Preparative Thin-Layer Chromatography (PTLC)
Preparative chromatography allows the use of large quantities of sample to separate into fractions and identify the PrincipalActiveComponents (PAC) in crude extracts.
Cannabivarichromene (CBVC), a cannabinoid found in Asian hashish extract, was separated from other cannabinoids by PTLC prior the determination of it through GC-MS. Chromatograms, under UV-light showed two unusual, intense cannabinoid spots besides the major components Δ9-THC, CBD, and cannabinol (CBN). [10]
TLC in the analysis of synthetic cannabinoids
Designer drugs, also called newpsychoactivesubstances (NPSs), include compounds that are produced to mimic the effects of cannabis. Molecules like JWH-018 have been identified as an adulterant in an herbal product being sold in Japan (Spice) for its narcotic effect after isolation by PTLC. [11]
TLC in forensic analysis
TLC was employed to obtain detailed information on the age and origin of cannabis samples with significance in forensic analysis. The absence of CBD and, if present, its ratio to Δ9-THC in extracts were the most useful criteria in origin assignment, while the apparent CBN content reflected the sample age.
This analysis was also performed with “doubled 2D TLC” developed per each side of the plates rotating it two times to obtain extra resolved diagnostic spots. [12]
Recording of morphological features plus two thin layer chromatographic systems were used to determine cannabinoids present in forensic cannabis samples. Analysis provided separation and identification of various cannabinoids including Δ8-THC, Δ9-THC, cannabichromene (CBC), CBD, cannabigerol (CBG), and CBN. [13]
Analysis of urine
Cannabis use is determined by detecting the metabolite Δ9-tetrahydrocannabinol-11-oic acid in urine by employing double development thin-layer chromatography for identification based on its characteristic Rf value and color after spraying the plate with a reagent salt. [14]
Thus, the scientists reviewed The use of TLC for screening abused drugs in urine. It included cannabinoids such as Δ9-THC. Preliminary identification by TLC was confirmed using more specific analysis by GC-MS. [15]
The advantages of TLC method are:
- Low equipment cost;
- Rapid analysis;
- Simultaneous determination of several drugs and metabolites.
Analysis of hair
Hair samples of cannabis users were qualitatively analysed by TLC and quantitatively determined by GC-MS. Amounts of the cannabinoids in hair ranged from 0.25-2.82 ng/mg according to the validated GC-MS method. [16]
References:
[1] Natural Products Isolation Edited by Richard J. P. Cannell.
[2] O. Kaynar; Y. Berktas. “How To Choose the Right Plate for Thin-Layer Chromatography?”, 2010.
[9]Monograph Cannabis Flos Version 7.1, November 28, 2014, Federal Institute for Drugs and Medical Devices (BfArM), Bonn, Germany.
[17] Hauber, D. J. Marijuana Analysis with Recording of Botanical Features Present and without the Environmental Pollutants of the Duquenois-Levine Test. J. Forensic Sci. 1992.
